Coffee Shop Business Strategy
Insights from Survey and Taste Test Data
Goal
Tastes are always changing, and coffee is no different. With more people drinking coffee every year and more products, companies want to jump in -- but how? This project aims to answer that with data
Process
A huge key to this project is understanding the customer and market. First, devices send information which is changed through middle-men, then stored and displayed live
Insights
1. Men prefer fruity light-roast pourovers, women favor medium-roast chocolatey lattes
2. Age group influences spending habits and flavor preferences
3. 1 in 3 respondents already spend $6-$8 per cup, and nearly 1 in 5 want premium coffee over $20
Project Overview:
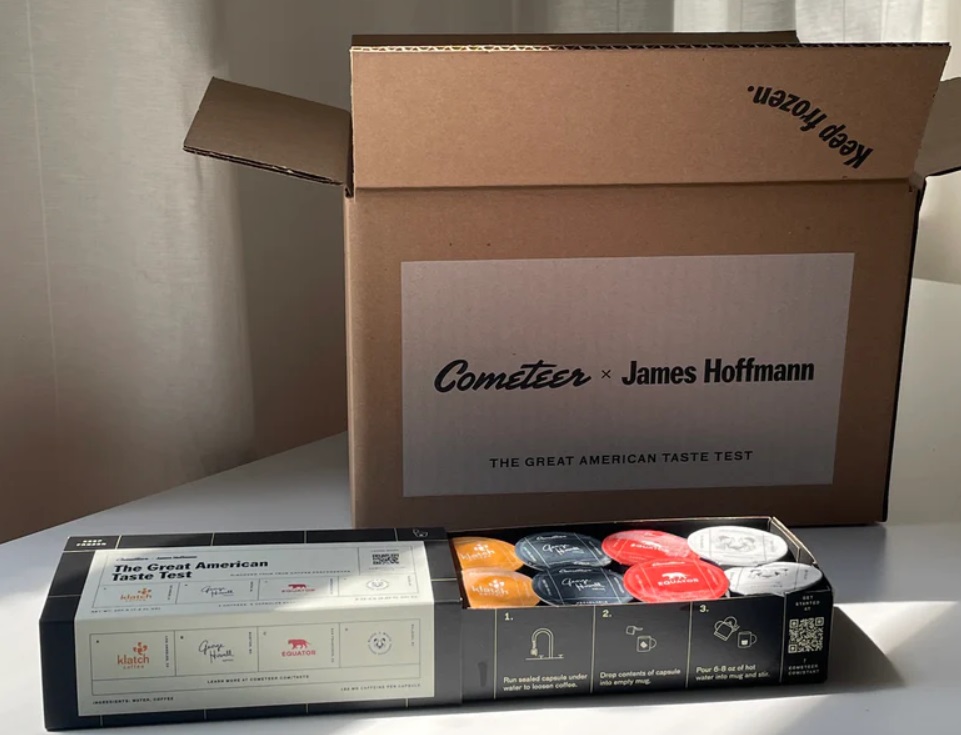
This project analyzes local pricing, survey responses, and taste test data from YouTuber James Hoffman’s and Cometeer’s “The Great American Coffee Taste Test” to help investors develop a data-driven strategy for opening a specialty coffee shop. The focus is on identifying customer preferences, ideal product offerings, and pricing strategies to maximize profitability while fostering a strong community-oriented coffee culture.
Quick Insights:
- Men tend to prefer fruity light-roast pourovers, while women favor medium-roast chocolatey lattes
- Age group influenced spending habits, as well as flavor, roast, and drink preferences
- 1 in 3 respondents are already spending $6-$8 per cup, 1 in 4 are willing to spend $8-$10, with nearly 1 in 5 seeking premium coffee over $20.
Table of Contents
Data Sources:
Survey and taste test data from the "Great American Coffee Taste Test" (James Hoffman & Cometeer)
Sample of prices from 10 cafes serving specialty coffee in the Tampa-Sarasota, FL area
Green coffee prices from Coffee Bean Corral
Specialty Coffee Retail Price Index from The Specialty Coffee Transaction Guide
Tools
- Google Sheets (data cleaning, EDA, visualizations)
- Tableau (dashboard)
- Google Slides and YouTube (presentation)
Data Cleaning and Preparation
- NULL values ignored in Pivot Tables
Exploratory Data Analysis
- What type of customer should we target?
- What are their preferences?
- What product and/or service can we offer?
- How can we align prices with customer value perception?
Data Analysis
Men's Product Preferences differed greatly from women's
Here are the same questions posed to women

Under the hood we're essentially filtering out bad responses, selecting one gender, checking the average response to each question and ordering it from greatest to least
WITH FilteredResponses AS (
    SELECT
        respondent_id,
        favorite_drink,
        favorite_flavor,
        coffee_roast,
        COUNT(*) OVER() AS total_responses -- Counts total male respondents
    FROM
        survey_data
    WHERE
        gender = 'Male'
        AND favorite_drink IS NOT NULL
        AND favorite_flavor IS NOT NULL
        AND coffee_roast IS NOT NULL
)

-- Now, calculate the percentage for each question and response type
SELECT
    'Favorite Drink' AS question,
    favorite_drink AS response,
    COUNT(*) * 100.0 / MAX(total_responses) AS percentage
FROM
    FilteredResponses
GROUP BY
    favorite_drink, total_responses

UNION ALL

SELECT
    'Favorite Flavor' AS question,
    favorite_flavor AS response,
    COUNT(*) * 100.0 / MAX(total_responses) AS percentage
FROM
    FilteredResponses
GROUP BY
    favorite_flavor, total_responses

UNION ALL

SELECT
    'Coffee Roast' AS question,
    coffee_roast AS response,
    COUNT(*) * 100.0 / MAX(total_responses) AS percentage
FROM
    FilteredResponses
GROUP BY
    coffee_roast, total_responses;
Here we have local prices in the Tampa-Sarasota area
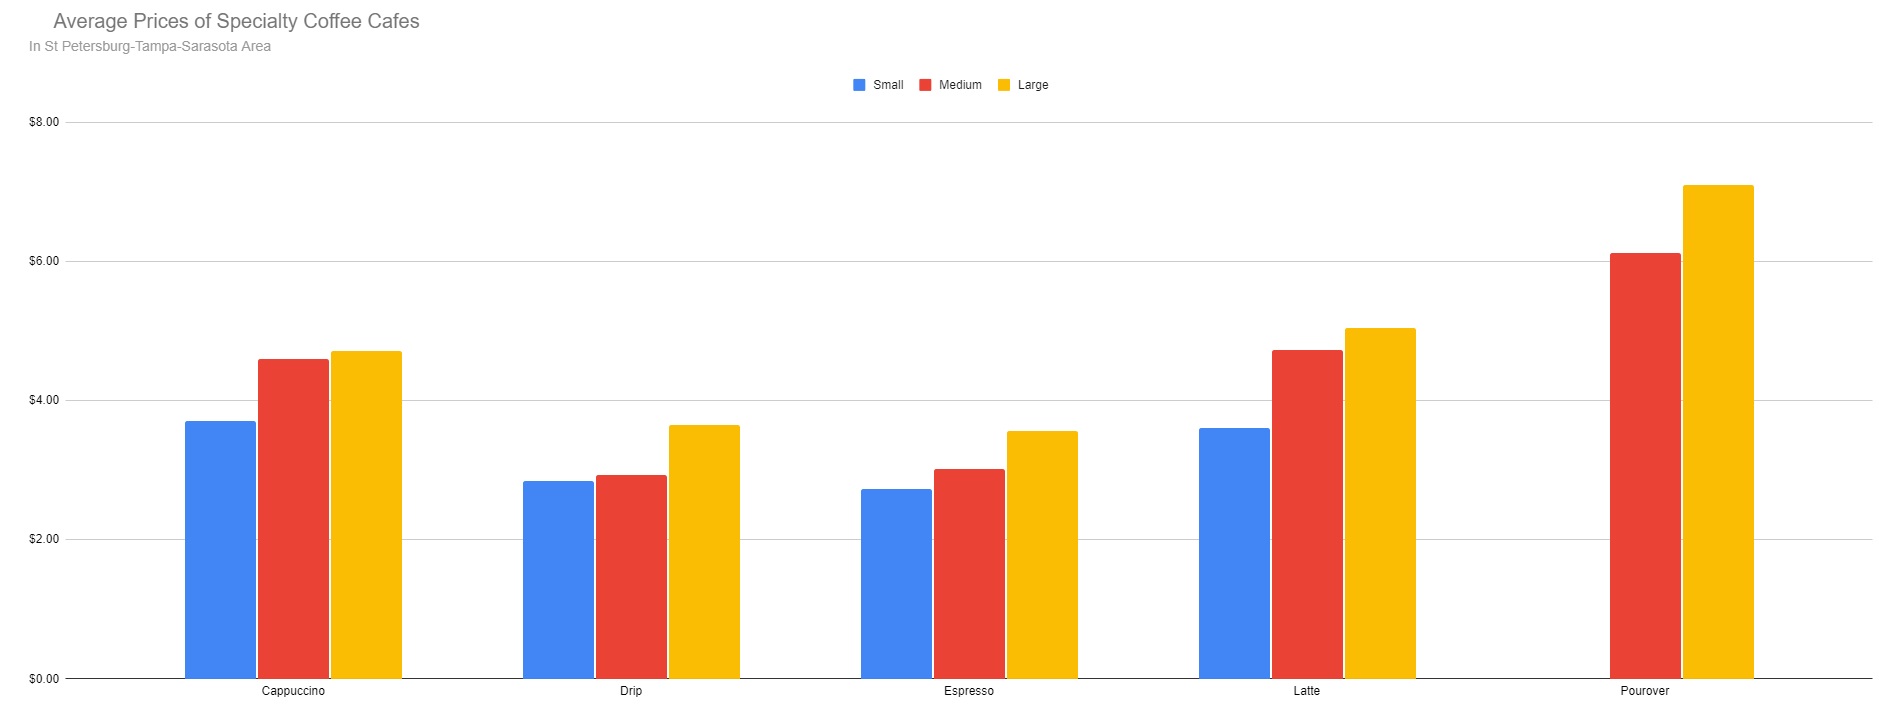
which we can compare with our survey responses (both genders selected)

Results
- Customer Profile:
The target market includes older Gen Z and Millennials with disposable income, no kids, and a preference for quality coffee. The majority consume 1-2 cups of coffee daily. - Specialty Coffee Appeal:
There’s a market for ethically sourced, premium single-origin coffee, with consumers willing to pay more to support sustainable farming practices. - Pricing Tiers:
Customers are most comfortable paying between $6-$8 per cup, with a significant portion willing to spend over $15 for premium offerings.
Recommendations
- Product Offerings:
- Focus on fruity, light-roast pourovers for men and medium-roast, chocolatey lattes for women.
- Introduce specialty roasted beans for at-home brewing, aligning with the customer preference for home coffee experiences.
- Customer Experience:
- Offer brewing and latte art classes to enhance the customer experience and build loyalty.
- Implement limited-run snacks from local businesses to complement the coffee experience.
- Pricing Strategy:
- Set pricing tiers in the $6-$15 range based on coffee quality and type, with premium offerings priced above $15 for specialty drinks.
- Highlight the ethical and sustainable aspects of your coffee to justify premium pricing.
Limitations
Survey Bias:
Respondents may have skewed results due to over-reporting of preferences or willingness to spend.
Taste Test Sample Size:
The number of taste test samples may not fully represent broader consumer preferences. Subsequent customer segmentation isn't rigorous due to sample size and...
Selection Bias:
Respondents are not representative of the greater population, showing greater interest and experience by choosing to participate in a coffee taste test conducted by a coffee YouTuber
Self-Reported Data:
Results are based on self-reported survey data, which may introduce inaccuracies in spending habits or taste preferences.
References
Here is a PDF of my Google Slides as seen in my YouTube presentation
Why Single-Origin Coffee is So Expensive from Business Insider